10 steps for powerful infographics
Creating an informative yet engaging medical infographic is not easy. If it were, pharma companies wouldn’t invest in our knowledge and experience in developing them. But even though making great infographics isn’t easy, that doesn’t mean it needs to be complicated.
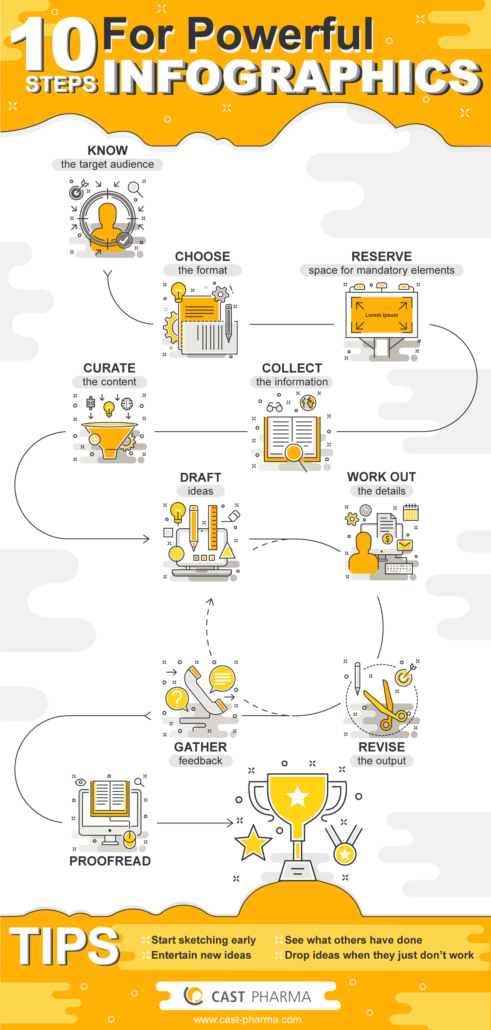
Here are 10 steps we use at CAST PHARMA to develop infographics that meet client needs and engage target audiences.
 10 steps for powerful infographics
1. KNOW the target audience
For any infographic, it is crucial to understand the target audience. A cartoonish illustration may land well with patients but fall flat for healthcare professionals (HCPs), while a Kaplan-Meier curve may be easily understood by HCPs but not patients. Therefore, always consider the audiences’ interests, concerns, level of knowledge, and educational background.
2. CHOOSE the format
For an infographic, virtually any format is possible. However, think of how and where the infographic will be presented. Will it be shown on a poster at a conference booth or on a mobile-friendly web page? Will it appear in a live presentation or an eLearning module for self-study? Choose the most suitable format (landscape, portrait, A4, US-letter, etc.) accordingly.
3. RESERVE space for mandatory elements
To meet regulatory and legal standards, our clients’ usually need a reference list, footnotes, disclaimers, logos, and approval codes. Dedicate space for them, and make sure that you are flexible enough to update these elements quickly.
4. COLLECT the information
Do the research! Collect information that serves the communication goal and suits your audience. Usually, the client can already provide input.
5. CURATE the content
Group the information and define key messages. Arrange the messages so that there is order and clarity. Write copy and insert charts or graphs that you would like to use.
6. DRAFT ideas
Think of ways to visualize your information. Think of illustrations, icons, and typography. Make simple pencil sketches. They will help you transform your ideas into something tangible. You will quickly realize what works and what doesn’t. This is also the step where you should commit to a layout. Also, consider company or product-specific branding, which can strongly influence the kinds of visuals you create.
7. WORK OUT the details
Finalize the visuals, cut redundancies, and trim text where possible. Apply the Gestalt principles.
8. REVISE the output
Once all elements are in place, you may realize that an idea doesn’t work, a visual concept that you could improve, or a different way you could blend design, visuals, and text more effectively. Embrace those thoughts and do not hesitate to rearrange, redraw, or rephrase! Revising is an integral part of the creative process and will add to the quality of your infographic.
9. GATHER feedback
You may be satisfied with the product. But another pair of eyes may spot flaws or sees things that do not work the way they are intended to. Therefore, gather feedback and make changes if necessary.
10. PROOFREAD
Before you send the infographic to the client, you should check it thoroughly for any errors. Easily overlooked errors include spelling mistakes, typos, or numerical errors. Make sure that the file does not contain artifacts or unwanted comments. And off you go!
So, it’s not as complicated as you might think. If you follow the 10 steps and work your way from one step to the next, you can create compelling infographics very quickly and efficiently. And with that, you’ll be well on your way to making a lasting impression.


